Battery Assets Are Your Biggest Risk and Opportunity
Current Reality
Hidden Degradation
- Batteries fail without warning
- Warranty claims eat profits
- Safety incidents damage reputation
Operational Blindness
- No visibility into cell-level health
- Can’t optimize charge/discharge
- Missing revenue opportunities
Data Overload
- Thousands of data points
- No actionable insights
- Reactive, not predictive
BattOps Solution
Predictive Intelligence
- 90-day advance failure warning
- Proactive maintenance scheduling
- Risk mitigation before incidents
Optimization Engine
- Cell-level digital twins
- Revenue-optimized cycling
- 20% more usable capacity
Actionable Insights
- Clear recommendations
- Prioritized alerts
- ROI-driven decisions

The SOC Accuracy Advantage
Precision SOC: The Hidden Profit Multiplier
The Economics of Accuracy: Every 1% improvement in SOC accuracy = $300K annual value per 100MWh
BESS Operations
Traditional BMS (±5-10% error)

- Operating Window: 20-80% SOC
- Usable Capacity: 60MWh
- Daily Cycles: 1.5
- Annual Revenue: $4.2M
- ROI: 12%
Physics-Informed (±1.3% error)

- Operating Window: 10-90% SOC
- Usable Capacity: 80MWh
- Daily Cycles: 2
- Annual Revenue: $5.6M
- ROI: 18%

We Track What Others Can't See:
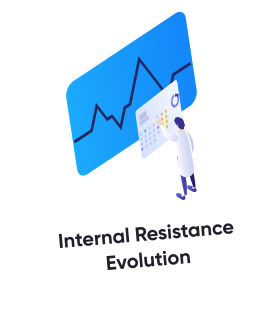
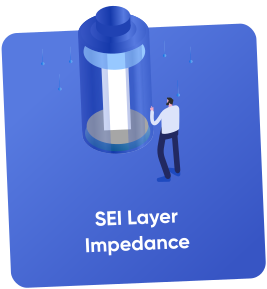
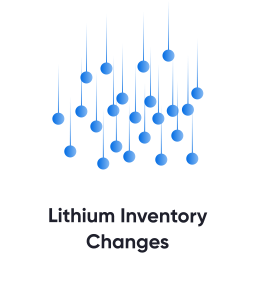
Know exactly how much energy is available, not just voltage readings
Test Conditions
- New cells
- After 500 cycles
- Temperature extremes (-20°C)
- High C-rate (2C)
- Mixed chemistry packs
BattGenie
- ±1.3%
- ±1.5%
- ±2.0%
- ±1.8%
- ±2.1%
Industry Standard
- ±5%
- ±8%
- ±12%
- ±10%
- ±15%
The Profit Cascade
10M+
More usable capacity
98.7%
SOC Accuracy
33%
More cycles per year
$1.4M
Additional revenue per 100MWh
2 Years
Faster payback









How BattOps Works? Powered by BattStudio's Physics-Informed Intelligence
The steps involved in using BattOps:
Flexible deployment options designed for your operational requirements
Cloud Deployment
- Fully managed SaaS
- Auto-scaling
- 99.9% uptime SLA
- SOC 2 compliant
Hybrid Deployment
- Edge processing
- Cloud analytics
- Reduced latency
- Data sovereignty
On-Premise
- Complete control
- Air-gapped option
- Custom integration
- Enterprise support